
TOOL SELECTION GUIDE
12 Network Troubleshooting Tools in 2026
Updated
You have “the internet is down” and a ticket that could mean a dead router, a broken DNS record or an overloaded server on another continent. The problem with network troubleshooting is rarely a lack of tools — it is picking the right tool for the layer that is actually failing. Every utility answers one narrow question, and running the wrong one wastes an hour while the right one finds the fault in a minute.
This guide maps 12 network troubleshooting tools to the layer each one tests, with the exact commands for Windows, macOS and Linux, a symptom-to-tool table and the order that turns a vague outage into a specific, fixable fault.

Which network troubleshooting tools matter most?
For most incidents, start with IP configuration, ping, DNS lookup, a TCP port check and traceroute. Those five checks establish whether the device has a valid address, the destination is reachable, its name resolves, the service accepts connections and the path between the two networks is healthy. Packet capture and scanning tools come later, when the basic checks have narrowed the fault but not explained it.
- Reachability and loss: ping.
- Network path and hop latency: traceroute or MTR.
- Name resolution: nslookup or dig.
- Service availability: a TCP port checker, Test-NetConnection or netcat.
- Local address and gateway: ipconfig, ifconfig or ip.
- Application timing: curl or a remote website speed test.
- Packet-level evidence: Wireshark or tcpdump.
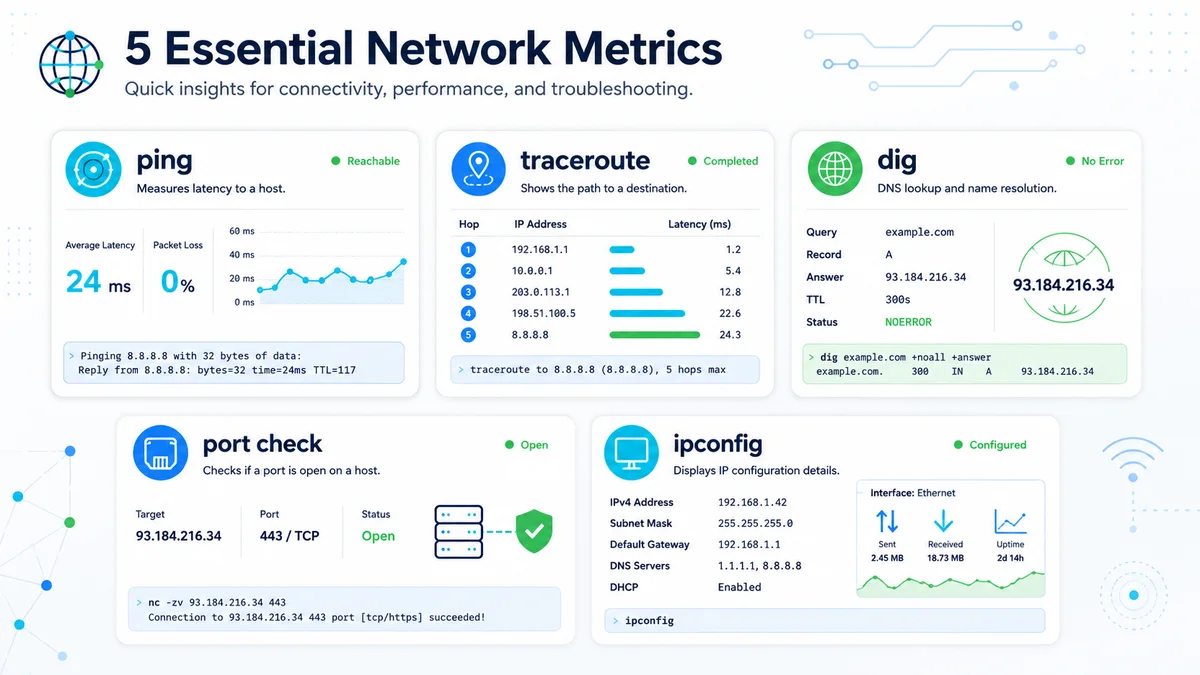
Network troubleshooting tools at a glance
| Tool | Best question it answers | Runs from |
|---|---|---|
| Ping | Is the host reachable, with what loss and latency? | Local device or remote probe |
| Traceroute / tracert | Which hops form the path and where does delay begin? | Local device or remote probe |
| Nslookup / dig | Does the name resolve to the expected DNS records? | Local device or remote resolver |
| Port checker / netcat | Can a TCP connection reach this one service port? | Local device or remote probe |
| Ipconfig / ifconfig / ip | Does this device have a valid address, gateway and DNS setup? | Local device |
| Netstat / ss | Which local ports and connections are active? | Local device or server |
| Route / ip route | Where will this device send traffic for each network? | Local device or router |
| Curl | Where does an HTTP request spend time and what did the server return? | Local device |
| MTR | How do loss and latency behave across the route over repeated samples? | Local device or supporting probe |
| Wireshark / tcpdump | What packets were actually exchanged? | Local device or server |
| Nmap | Which authorized hosts and ports respond? | Authorized test device |
| Browser DevTools | What failed inside a browser request or page load? | Browser |
The 12 essential network troubleshooting tools
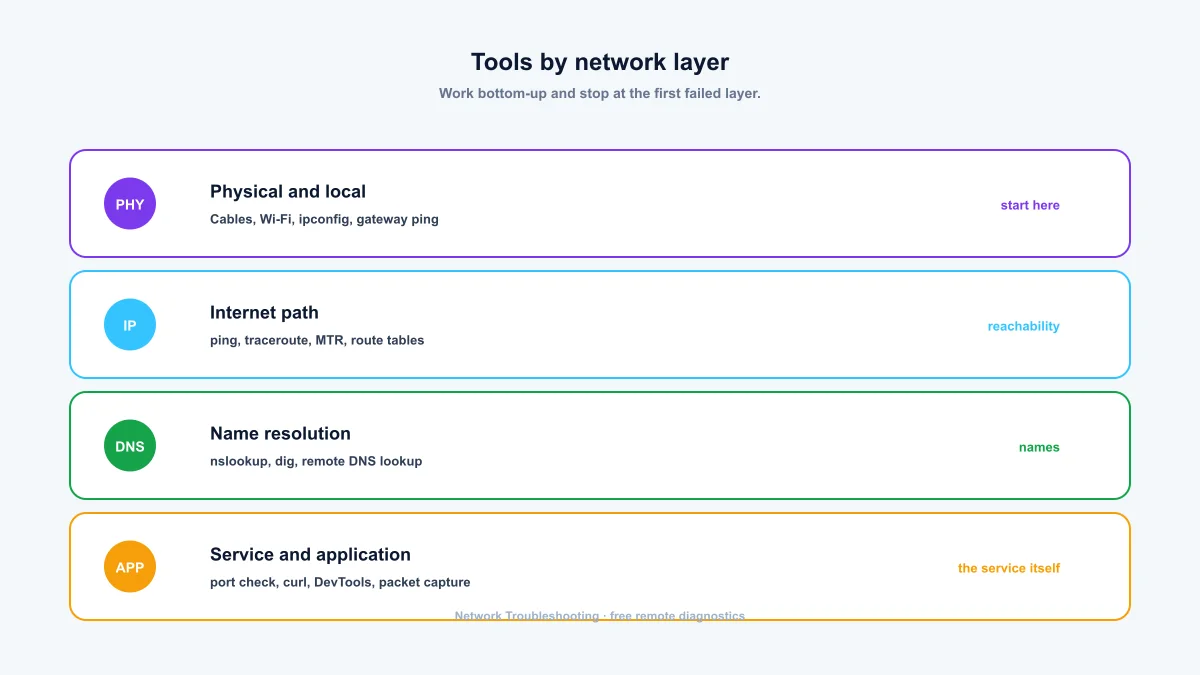
1. Ping: reachability, packet loss and latency
Ping is the fastest first check for a public host. It sends ICMP echo requests and reports whether replies return, how long they take and how many are lost. A clean ping proves basic IP reachability; it does not prove that a website or another TCP service is working, and some networks deliberately ignore ICMP.
ping -n 4 example.com
ping -c 4 example.com2. Traceroute: network path and hop latency
Traceroute increases the packet time-to-live one step at a time so routers along the path can identify themselves. Use it after ping shows a timeout, unstable latency or a problem that only appears from one region. A row of asterisks is not automatically a fault: routers often forward traffic while declining to answer traceroute packets.
tracert example.com       # Windows
traceroute example.com # macOS and Linux3. Nslookup and dig: DNS resolution
DNS tools show which records a resolver returns for a name. Compare the configured resolver with a known public resolver when sites work by IP address but not by hostname, mail records appear wrong, or a DNS change is not visible everywhere yet.
nslookup -type=MX example.com
dig example.com A
dig example.com TXT4. Port checker, Test-NetConnection and netcat: service reachability
A TCP port test asks a narrower question than ping: can a connection be established to this service? Use it for HTTPS on 443, SSH on 22 or another known TCP service. A failure can mean the application is stopped, the port is not listening, a firewall is filtering it or network address translation is missing.
Test-NetConnection example.com -Port 443
nc -vz example.com 4435. Ipconfig, ifconfig and ip: local network configuration
These commands reveal the device address, subnet, gateway, interface state and DNS configuration. Check them before blaming the internet. An IPv4 address beginning with 169.254 usually means the device did not receive a DHCP lease; a missing default gateway means it has no route beyond the local subnet.
ipconfig /all           # Windows
ifconfig                # macOS
ip addr && ip route     # Linux
6. Netstat and ss: active ports and connections
Netstat and ss inspect the local machine rather than the remote path. They answer whether an application is listening on the expected address and port, which process owns a connection and whether sockets are stuck in states such as SYN-SENT or TIME-WAIT.
netstat -ano             # Windows
ss -tulpn               # Linux
7. Route and ip route: routing-table inspection
A routing table decides which gateway receives each destination. Inspect it when traffic takes the wrong VPN, a second network adapter changes the default route, or one subnet is unreachable while the internet still works. Look for duplicate default routes and unexpectedly specific routes that override the path you intended.
route print              # Windows
netstat -rn              # macOS
ip route                # Linux
8. Curl: HTTP status, headers and timing
Curl tests the application layer without a full browser. It can expose redirects, TLS errors, response headers and server timing. Compare a local curl request with a remote synthetic measurement when a site is fast in one network but slow or unavailable in another.
curl -I https://example.com
curl -v https://example.com9. MTR: repeated path measurement
MTR combines repeated probes with a traceroute-style hop list. It is useful for intermittent loss and latency that a single trace might miss. Interpret it from the destination backward: apparent loss at an intermediate router is not meaningful when every later hop answers normally.
mtr --report --report-cycles 20 example.com10. Wireshark and tcpdump: packet capture
Packet capture is the evidence tool for problems that survive the earlier checks. It can show repeated TCP retransmissions, failed TLS negotiation, DNS retries and which side closed a connection. Capture narrowly, protect payload data and stop as soon as you have enough evidence.
tcpdump -nn host 203.0.113.1011. Nmap: authorized host and port discovery
Nmap can confirm which ports and services respond across systems you are responsible for. It is more powerful and more intrusive than a one-port check, so obtain authorization, limit the targets and ports, and follow the network provider’s acceptable-use rules. This site intentionally does not offer port-range scanning.
nmap -Pn -p 80,443 your-authorized-host.example12. Browser Developer Tools: browser request failures
The Network panel in browser developer tools shows DNS-independent application failures such as blocked requests, redirect loops, failed CORS checks, HTTP errors and slow assets. Use it when curl succeeds but the page still fails, or when only one request inside an otherwise working application is broken.
Which tool should you use for each symptom?
| Symptom | Start with | Then check |
|---|---|---|
| One device has no connection | Ipconfig, ifconfig or ip | Gateway ping and routing table |
| A hostname fails but an IP works | Nslookup or dig | Compare another DNS resolver |
| A server pings but the application is down | TCP port check | Netstat or ss on the server |
| A site is slow from one region | Website speed test | Traceroute or MTR from both regions |
| Connections reset or stall | Curl or application logs | Wireshark or tcpdump |
| A browser fails but curl works | Browser Developer Tools | CORS, cookies, redirects and client scripts |
| A service works locally but not publicly | Remote port check | Firewall, NAT and listening address |
The recommended troubleshooting order
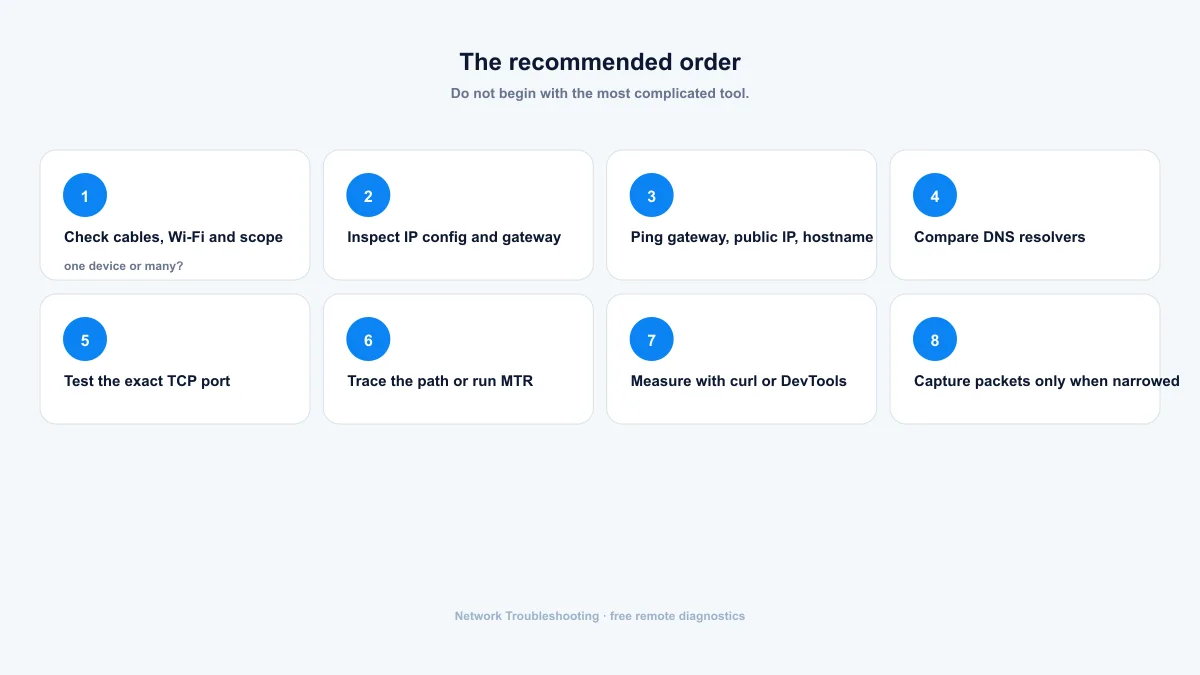
Do not begin with the most complicated tool. Start at the affected device and move outward. Stop at the first failed layer, correct it and repeat the test before moving on.
- Check cables, Wi-Fi and whether the problem affects one device or many.
- Inspect the local IP address, gateway, DNS servers and routing table.
- Ping the gateway, then a public IP, then the destination hostname.
- Resolve DNS records and compare a second resolver when names fail.
- Test the exact TCP service port instead of assuming ping proves the application works.
- Trace the path or run MTR when reachability varies by network or region.
- Measure the application with curl, browser tools or a remote website speed test.
- Capture packets only after the earlier tests define a narrow question.
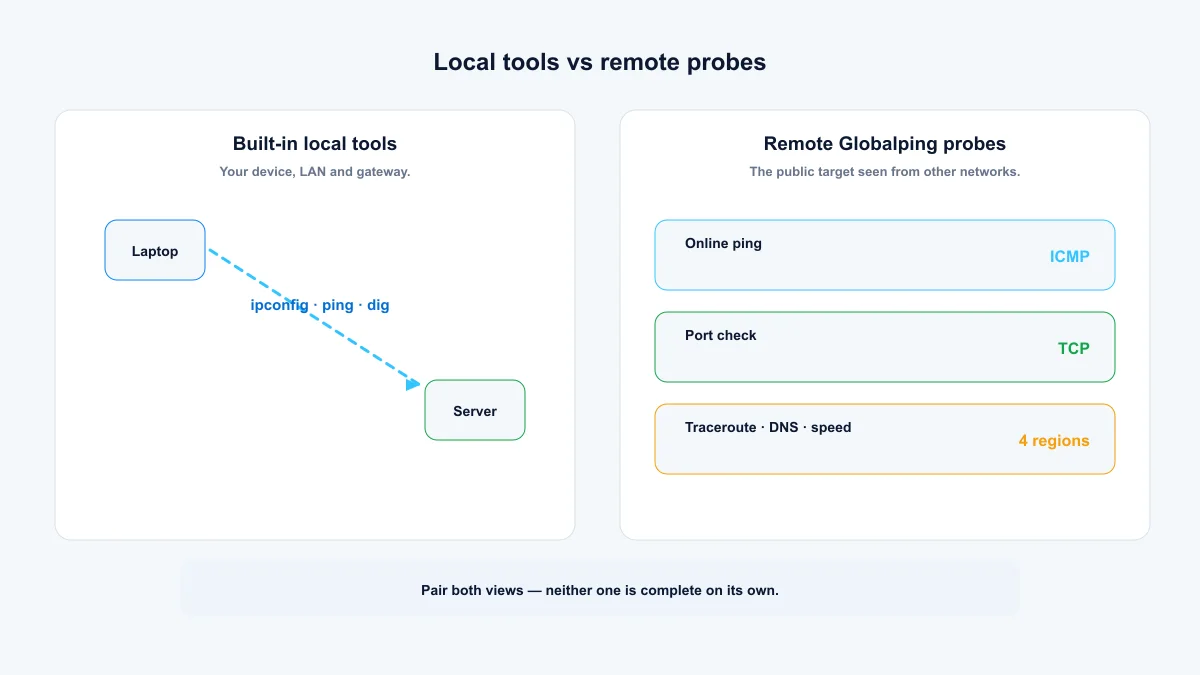
What remote tools can and cannot prove
A remote probe shows how a public target looks from another network. It is excellent for separating a local fault from a destination or routing problem, but it cannot inspect your Wi-Fi signal, private gateway, LAN firewall or device configuration. Pair remote results with local commands rather than treating either view as complete.
Every remote result on this site names the actual Globalping probe location. Probe selection is best-effort, results are synthetic measurements rather than browser Core Web Vitals, and complete diagnostic results are not stored by this application.
Summary: match the tool to the layer
No single tool answers every network question. Start with the layer you are unsure about: online ping for reachability, DNS lookup for names, a TCP port check for one service, traceroute for the path, and a website speed test for the application itself. Run the local commands first, then confirm from a remote probe when the fault could sit outside your network.
- The five core checks cover most incidents: IP configuration, ping, DNS, port and traceroute.
- Work bottom-up and stop at the first failed layer instead of launching the most complex tool.
- Remote probes show the public view; local commands show your device and gateway — pair them.
Frequently asked questions
What are the main network troubleshooting tools?
The core tools are ipconfig or ip for local configuration, ping for reachability, nslookup or dig for DNS, a TCP port checker for service access, and traceroute for the network path. Curl, MTR and packet capture add detail when those first checks do not fully explain the problem.
What is the best tool to check network issues?
There is no single best tool. Use ping for reachability, DNS lookup when names fail, a port check when one application is unavailable, and traceroute when the route or regional performance is suspect. Start with the tool that tests the first uncertain layer.
Which network troubleshooting tools are free?
Ping, tracert, nslookup, ipconfig, netstat, curl, tcpdump and the browser developer tools are included with common operating systems or available as free open-source software. The online ping, port, DNS, traceroute, IP and website timing tools on this site are also free without an account.
What network troubleshooting tools are built into Windows?
Windows includes ping, tracert, pathping, ipconfig, nslookup, netstat, route, arp and PowerShell Test-NetConnection. Together they cover local configuration, reachability, DNS, routes, active connections and individual TCP ports.
Should I use ping or traceroute first?
Use ping first because it quickly establishes reachability, loss and end-to-end latency. Run traceroute next when ping fails, latency is unexpectedly high or the result differs between networks and you need to see where the path changes.