
NETWORK PATH
Traceroute Explained: How to Read Hops and Find Problems
Updated
Ping can confirm end-to-end delay or packet loss, but it cannot show the path. Traceroute lists the routers that return TTL-expired replies and the round-trip time to each reply. Read as a pattern, it helps separate a local problem, an ISP or transit issue, and filtering near the destination.
This guide explains how to read traceroute output without blaming the wrong hop, how Windows tracert differs from Linux and macOS traceroute, and how to run a free online traceroute from a Globalping probe in the region you choose.
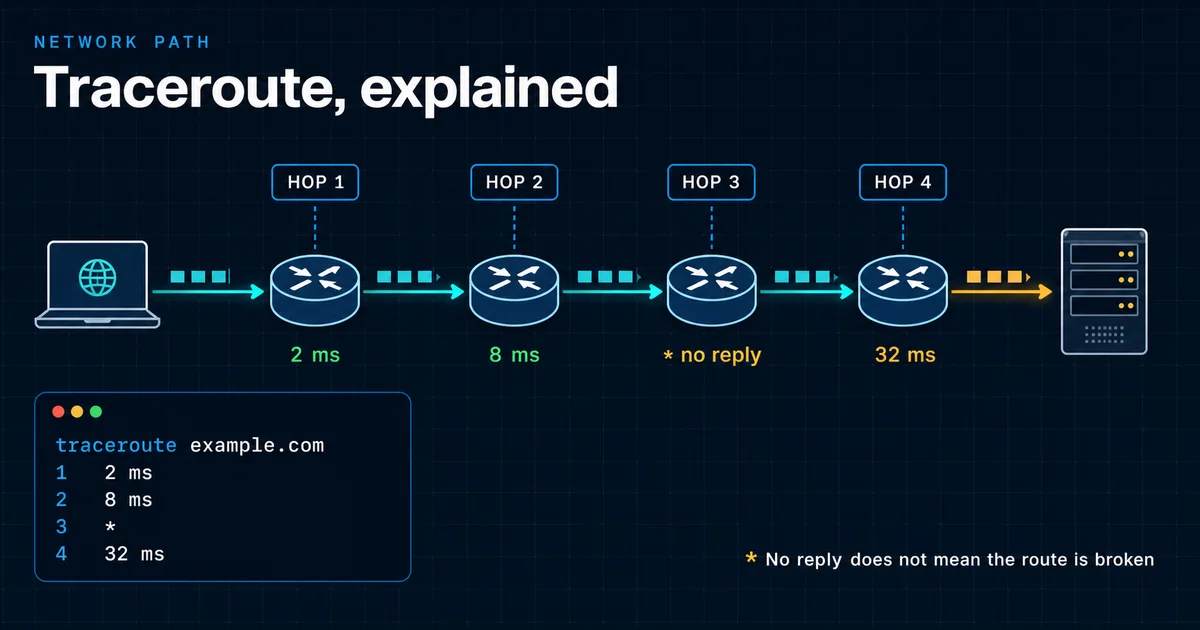
How to read traceroute in 30 seconds
Start at the destination and work backward. A single slow or silent intermediate hop is weak evidence because routers often rate-limit diagnostic replies. Look for a change that continues through every later hop, including the destination, then confirm it with another trace or a repeated test.
| Pattern | Likely meaning | Next check |
|---|---|---|
| One slow hop, later hops normal | ICMP reply de-prioritized at that router | Ignore that row unless the delay continues |
| Asterisks, then later hops reply | The router forwards traffic but does not answer probes | Treat the route as working |
| Latency rises and stays high to the destination | Distance, congestion or a routing change near that point | Repeat the trace and compare another region |
| Loss continues through all later hops | Possible end-to-end packet loss | Confirm with ping or MTR |
| Only the final hop times out | The destination may filter traceroute probes | Test the application port or website directly |
What traceroute shows
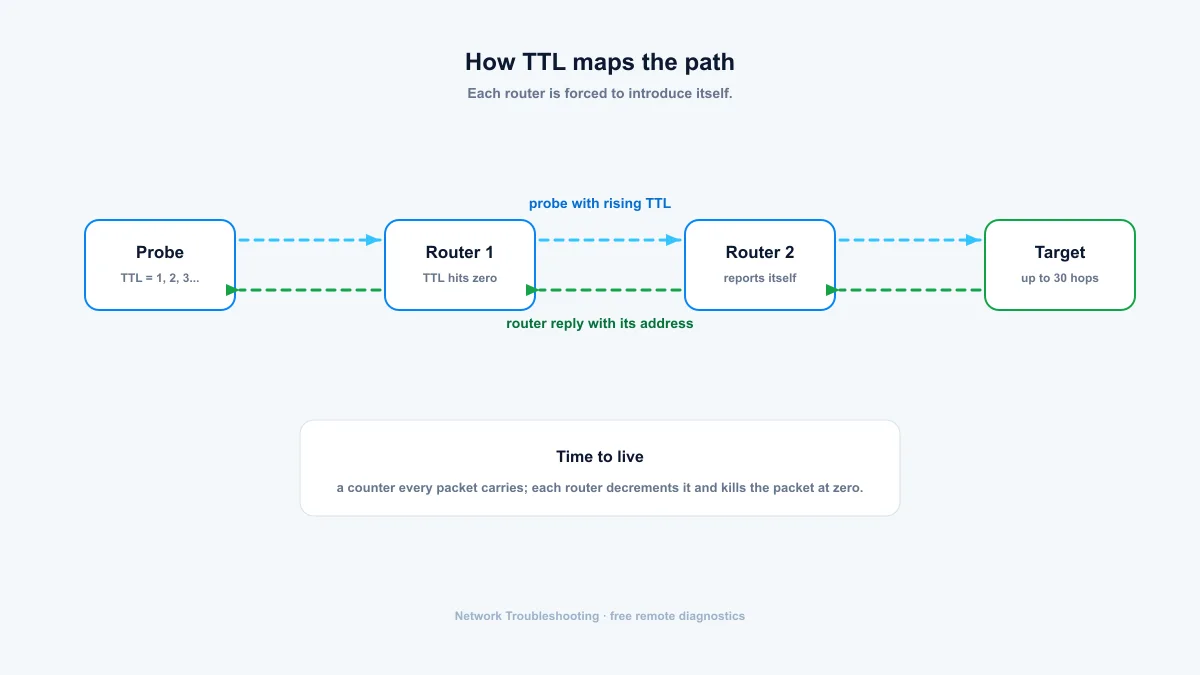
Packets hop from router to router toward their destination. Traceroute maps responding interfaces using the TTL field every IPv4 packet carries, called Hop Limit in IPv6. Each router decrements the value; when it reaches zero, the router normally drops the probe and sends an ICMP Time Exceeded reply.
Traceroute sends probes with TTL 1, then 2, then 3, and so on. The result is a list of responding router interfaces, usually capped at 30 hops, with round-trip times measured from the source to each reply and back. It is not a direct measurement of the link between two adjacent rows.
tracert and traceroute commands
Both tools are built into every OS. Windows calls it tracert; macOS and Linux call it traceroute.
Windows
tracert example.commacOS and Linux
traceroute example.comIPv6
tracert -6 example.com
traceroute -6 example.com
Reading a trace
Each line is one hop: the hop number, up to three probe times in milliseconds, and the router's hostname or address. A typical trace looks like this:
- Hop 1 is almost always your router, with a private address like 192.168.1.1.
- Each time is a round trip from your device to that hop and back, not the delay added by that router alone.
- Later hops can appear faster because replies may return by a different path or receive different processing priority.
- A latency increase matters most when it persists through the remaining hops and the destination.
- An asterisk means that router chose not to reply. It's not automatically a fault.
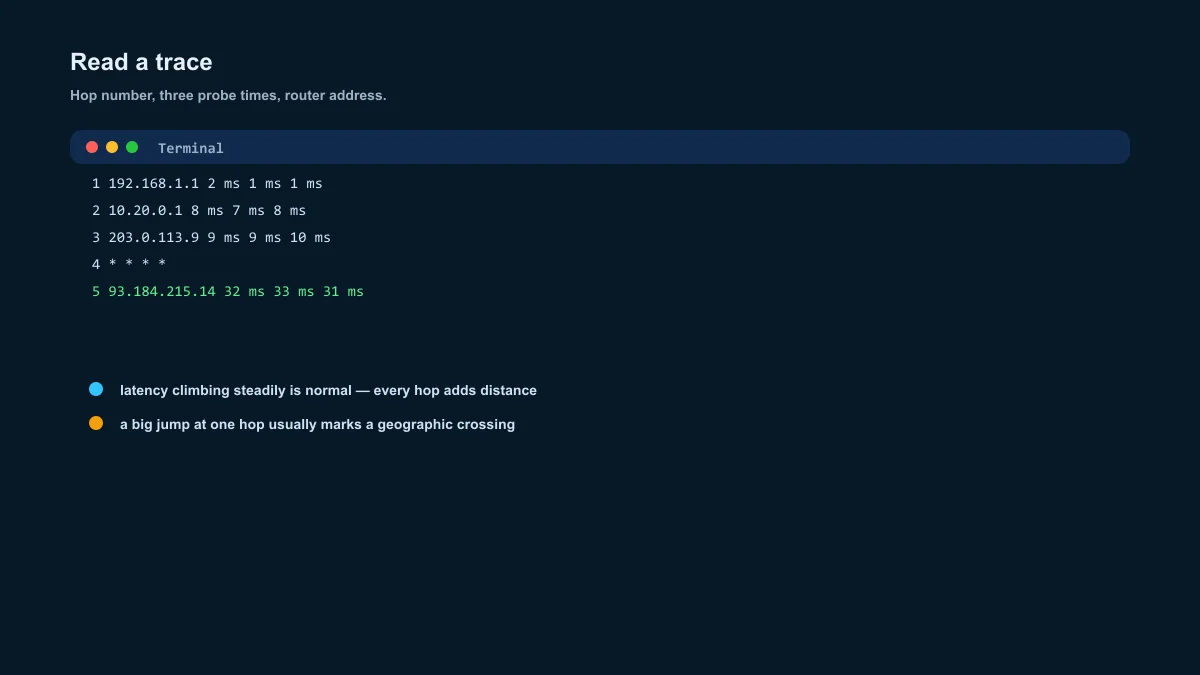
 1  192.168.1.1        2 ms    1 ms    1 ms
 2  10.20.0.1          8 ms    7 ms    8 ms   your-isp-gateway.example.net
 3  203.0.113.9        9 ms    9 ms   10 ms   transit-nyc.example.net
 4  *                  *       *       *
 5  93.184.215.14      32 ms   33 ms   31 ms  example.com
How to find the real problem hop
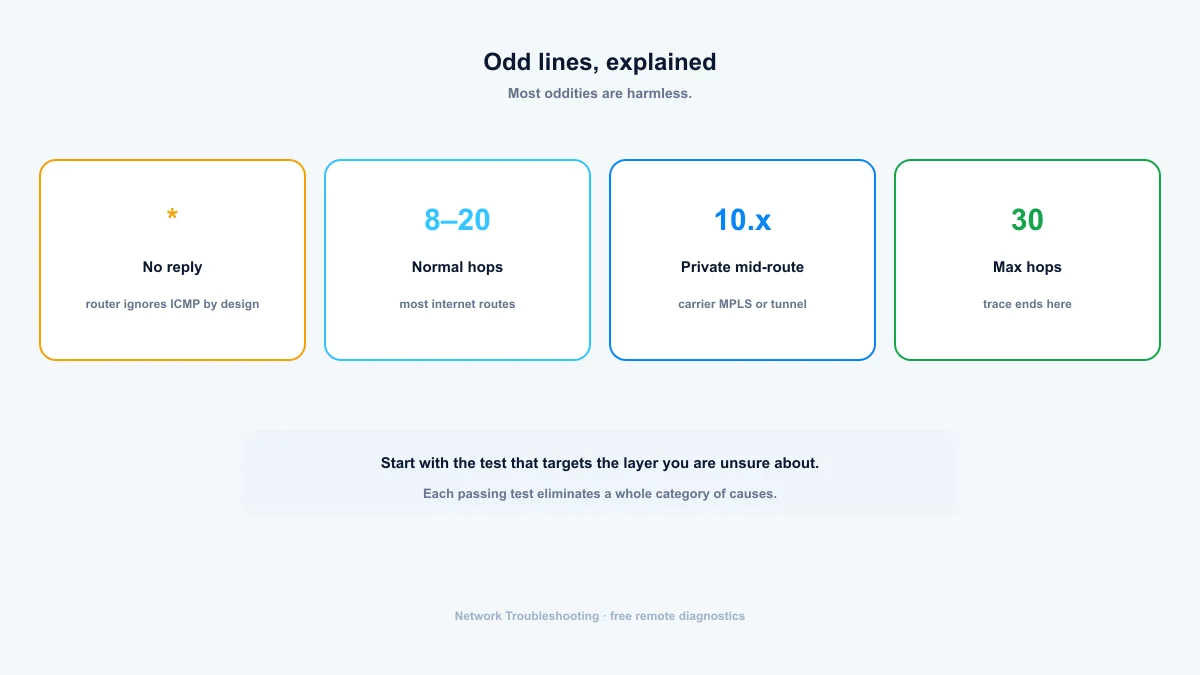
- Asterisks at one hop while later hops respond: that router silently drops ICMP. Common and harmless.
- Asterisks at the end: the final hops or the target itself don't answer ICMP. The route can still be complete.
- Latency stays low, then rises and remains high through the destination: investigate the link before the first sustained increase, while remembering that the return path can differ.
- High latency or apparent loss at one row followed by healthy later rows: the intermediate router is de-prioritizing replies, not dropping forwarded traffic.
- Private addresses (10.x, 172.16-31.x, 192.168.x) in the middle of the trace: you are inside your provider's core network or a tunnel. Normal for MPLS and carrier networks.
- The trace never reaches the target: the problem may sit at the last visible hop, or a downstream firewall is dropping packets.
Why traceroute results can differ
Windows tracert sends ICMP Echo probes by default. Traditional traceroute on Linux and macOS commonly uses UDP probes, while many implementations can also use ICMP or TCP. Firewalls and routers may treat those protocols differently, so two tools can reveal different responding hops even when application traffic follows the same network.
Load balancing can also send separate probes along different equal-cost paths. The reply path back to you may differ from the forward path being tested. For those reasons, traceroute is evidence about a path at one moment, not a complete proof of which router caused a slowdown.
- Use ICMP, UDP or TCP mode when a firewall filters the default probe type.
- Run traces while the problem is happening and again when the connection is healthy.
- Use MTR or repeated ping when you need sustained loss and jitter evidence rather than one snapshot.
- Compare remote regions when users in one geography report a problem that others do not.
Why run it from somewhere else
Your local trace shows the path from your network. Routing differs by region: a host can be 60 ms from Singapore and 180 ms from Europe, and a broken link can hit one region without touching another.
The online traceroute runs from a Globalping probe in a region you select and shows the probe's actual location in the result. Use it to compare paths from different continents, check a CDN's regional routing, or confirm a host is reachable from outside your ISP's network.
Ping vs traceroute
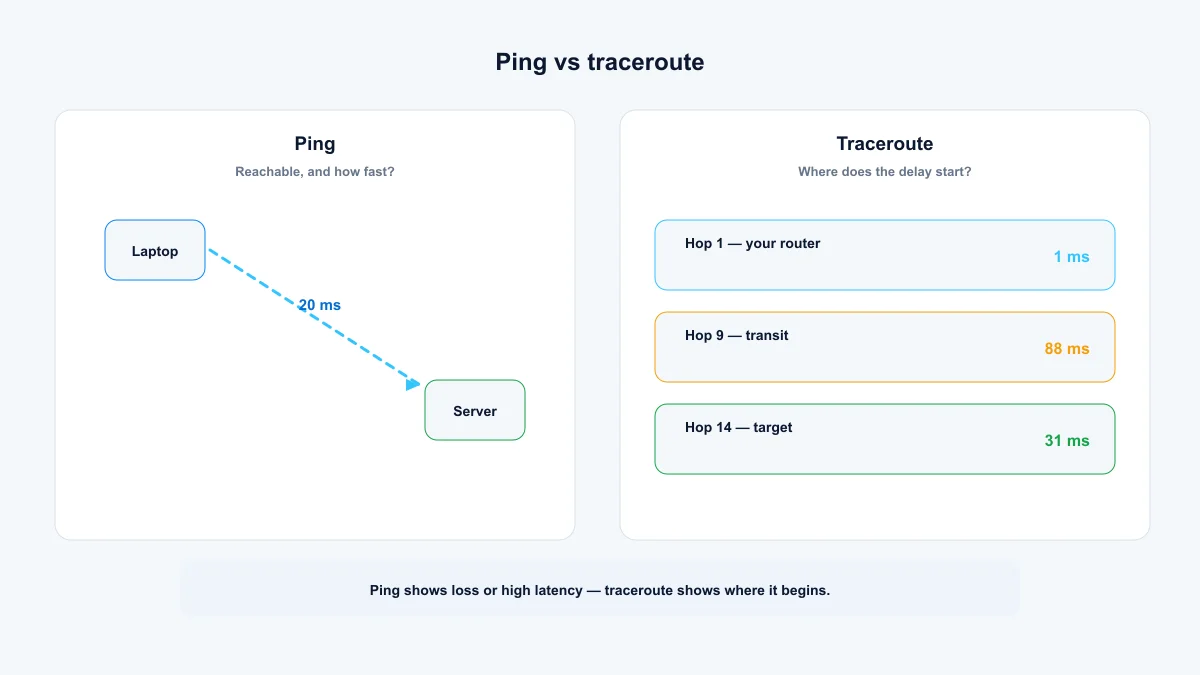
Ping gives the headline: reachable, and how fast. Traceroute gives the breakdown: which routers, and where the delay starts. When ping shows loss or high latency, run a traceroute to find out where it starts.
Summary: slow is a location, not a verdict
Run online ping for end-to-end reachability and latency, then traceroute to inspect the path. Compare traces from several regions because routing differs by geography. Do not diagnose from one slow row: a sustained change that reaches the destination is the stronger signal.
- Most internet routes are 8 to 20 hops.
- Asterisks followed by responding hops usually mean a router ignores probes, not a fault.
- Trace from a region your visitors use, not just your own desk.
Frequently asked questions
What does * mean in traceroute output?
That router didn't reply within the timeout. Most routers drop ICMP probes by design, so a few asterisks are normal. If later hops respond, the route is working.
How many hops is normal?
Most internet routes are 8 to 20 hops. Longer paths are common on satellite links or routes crossing many countries; very short ones happen when hosts sit on the same provider.
Why does hop 1 show my router?
Because it's the first device outside your computer. Every packet leaves through it. A private address like 192.168.1.1 confirms it.
What is TTL in traceroute?
Time-to-live: a counter in every IPv4 packet, decremented at each router, that discards the packet when it reaches zero and normally triggers an ICMP Time Exceeded reply. Traceroute sets it to 1, 2, 3... to discover responding router interfaces in sequence. IPv6 calls the field Hop Limit.
Can traceroute prove where packet loss starts?
Not from one trace. Apparent loss at an intermediate hop is often ICMP rate limiting. Loss is more credible when it begins at one hop and continues through every later hop and the destination; confirm it with repeated ping or MTR.
Free, no account required. Results show the exact probe location for every measurement.