
SYNTHETIC HTTP TIMING
Website Speed Test: Measure Load Time Remotely
Updated
A slow website is almost never slow everywhere — it is slow in one phase: DNS, the TLS handshake, the server generating the response, or the download. The difference matters, because throwing a CDN at a first-byte problem fixes nothing, and the only way to know which layer is guilty is to time each one separately.
The free website speed test on this site runs a restricted HTTP request from a Globalping probe in the region you choose and returns the phase-by-phase breakdown. This guide explains what each number means, what healthy looks like, and where synthetic timing stops being useful.
What the test measures
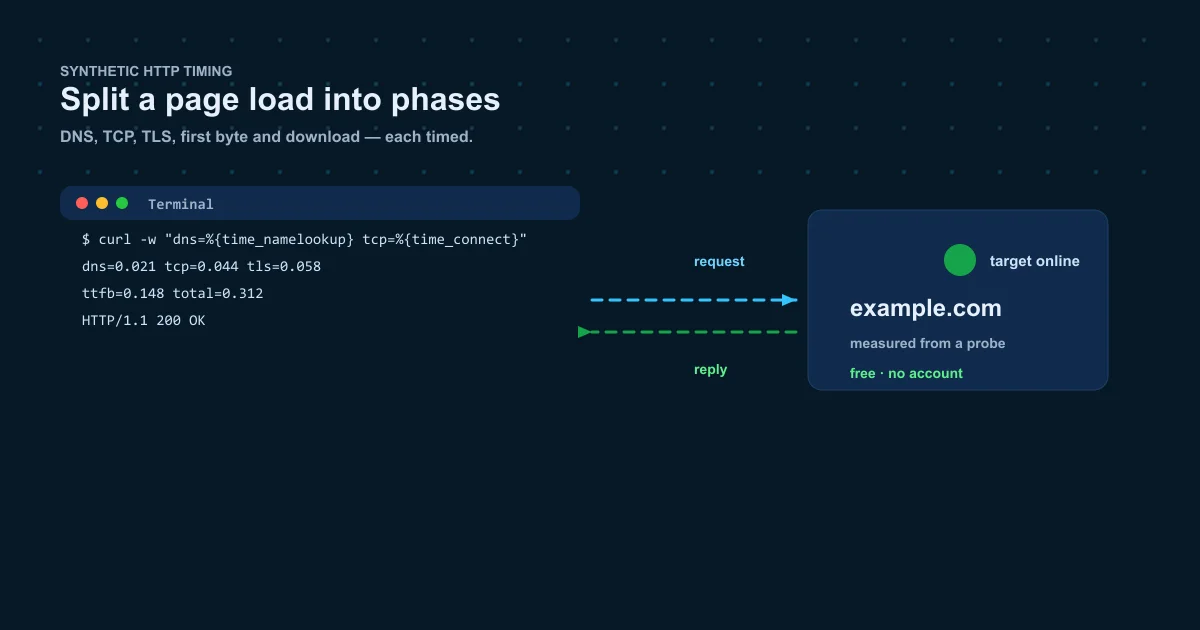
One restricted HTTP or HTTPS request from one probe, timed in phases. No custom headers, cookies, credentials or request bodies; it's a synthetic measurement, not a real browser session.
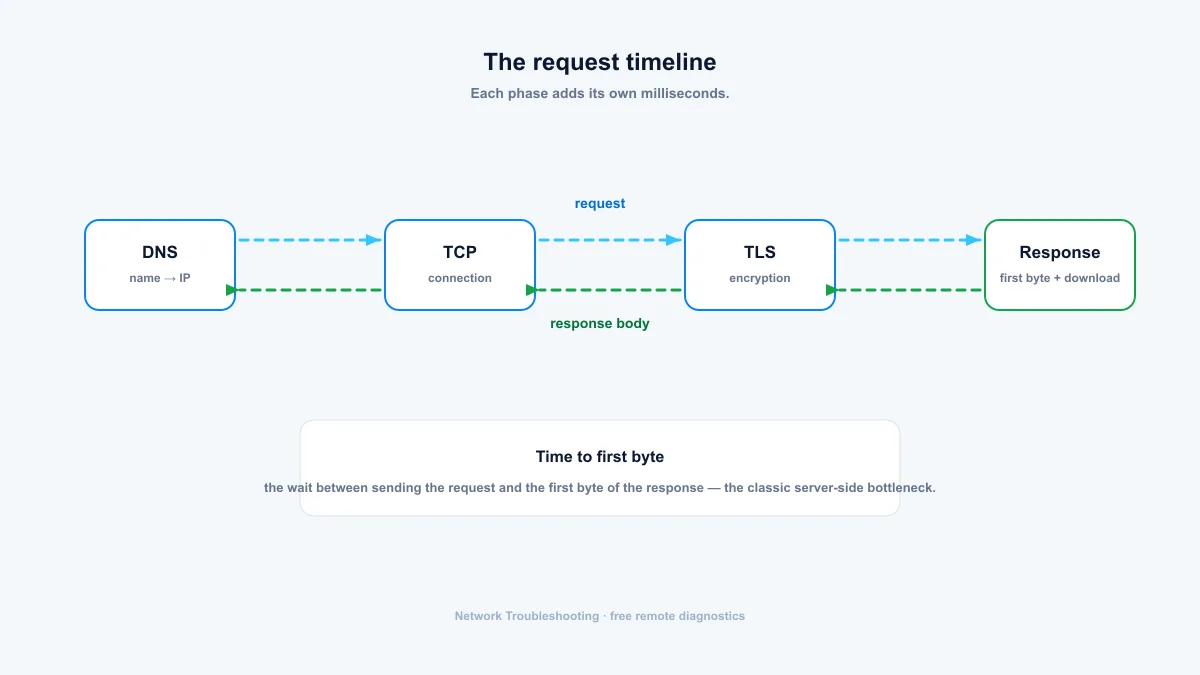
- DNS — resolving the name to an address
- TCP — connection handshake
- TLS — encryption handshake
- First byte (TTFB) — the wait for the server to produce the first byte of the response
- Total — the whole request, download included
Reading the breakdown
- High DNS time: the nameserver or resolver is slow. Fast authoritative DNS or a CDN's DNS helps.
- High TCP time: rare on healthy sites. If it's slow, the server is overloaded or the path is congested.
- High TLS time: TLS 1.3 brings the handshake down to one round trip. A slow one usually means an old configuration or a CPU-bound server.
- High first byte: the server is slow to generate the response. This is the most common bottleneck: database queries, unoptimized frameworks, cold caches all show up here.
- Fast first byte, slow total: the response is large, or the path between probe and server is thin.
Server-side speed vs browser speed
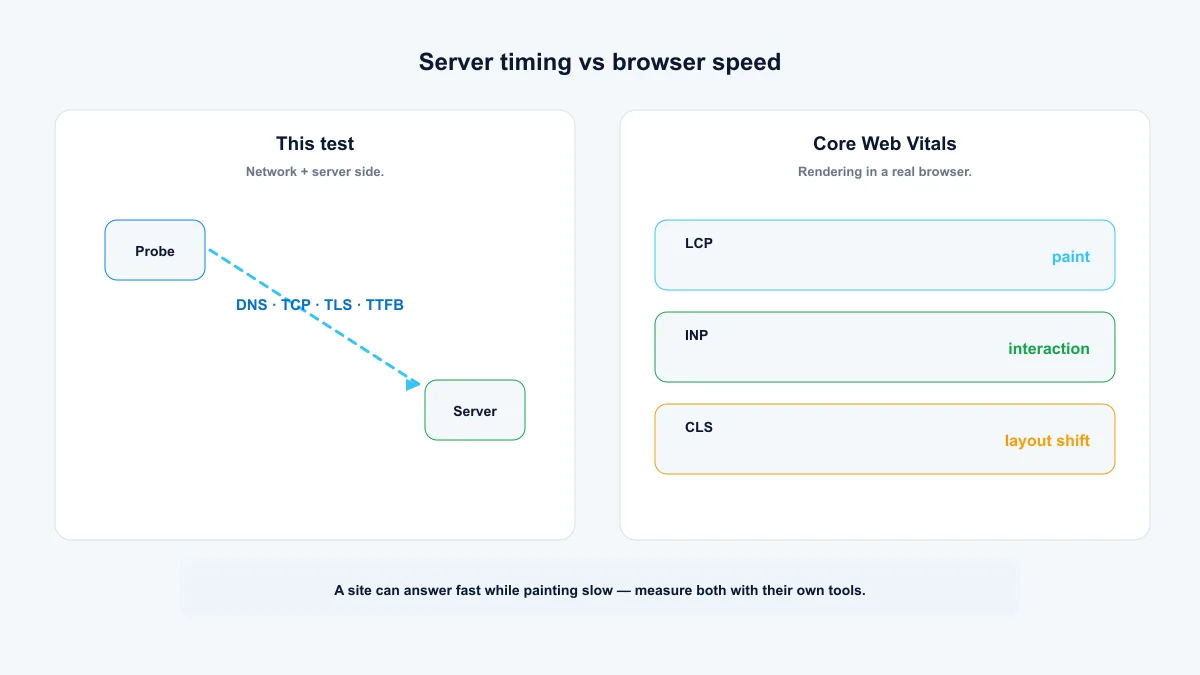
This test measures the network and server side of a request. It is not Core Web Vitals and does not represent a visitor's browser: rendering, JavaScript, images, everything after the response arrives is out of scope. A site can answer fast while painting slow.
Use this tool to verify hosting, TLS and routing. Use PageSpeed Insights or the DevTools performance panel for rendering. When both are slow, fix the server side first: it costs every visitor, while front-end issues are per-page.
Test from several regions
A test from your office measures your ISP. Visitors elsewhere take different paths, and a Frankfurt-hosted site will be fast in Europe and slow in Asia no matter how well it's built. Running each region shows what's distance (expected), what's routing (fixable with a CDN), and what's capacity (fixable with infrastructure).
Making slow timings fast
- High TTFB: look at database queries, caching layers and web server config; enable opcode and object caching; consider a faster hosting tier.
- High DNS time: move DNS to a fast authoritative provider or a CDN's DNS, and cut down resolution round trips.
- High TLS time: enable TLS 1.3, session resumption and OCSP stapling; upgrade hardware if handshakes are CPU-bound.
- High total time: compress responses (gzip/brotli), trim page weight, put static content on a CDN.
- Slow from distant regions consistently: use a CDN with points of presence near those regions, or move the origin closer.
Summary: find the slow phase, fix that layer
Run the website speed test from a region your visitors use, read the breakdown, and fix the phase that hurts: DNS, TCP/TLS, first byte or total size. A slow first byte is a server problem; slow distant results are a routing or CDN problem; a slow browser is Core Web Vitals territory and needs different tools. One number can mislead — the phases cannot.
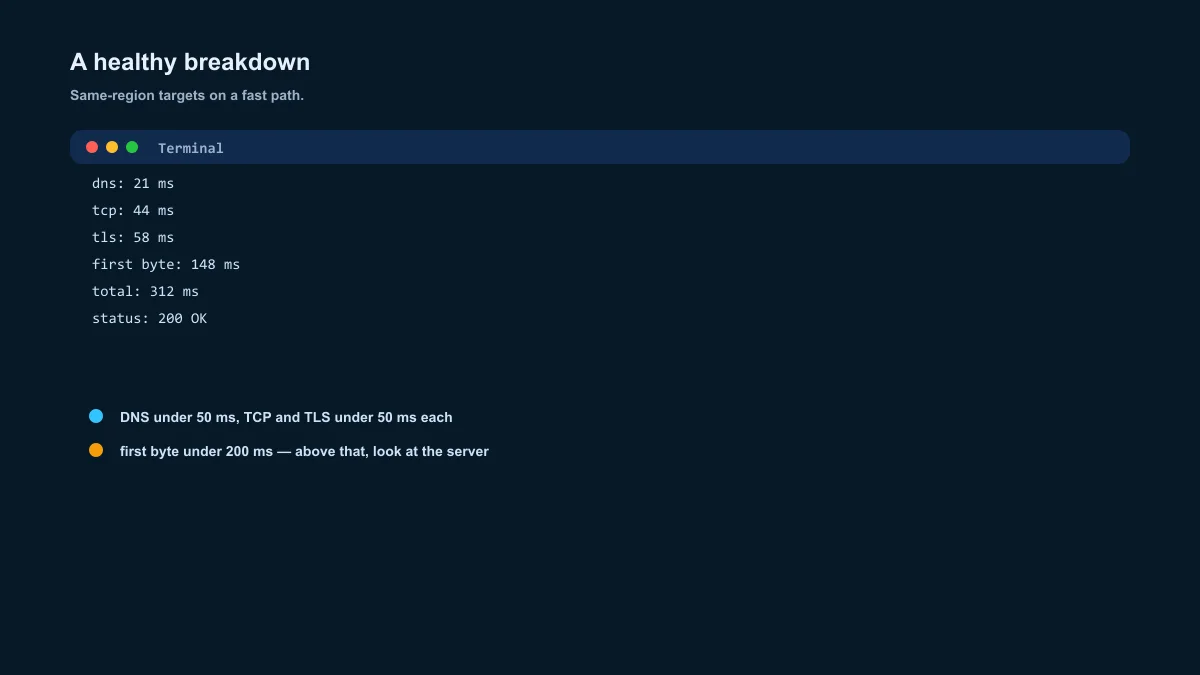
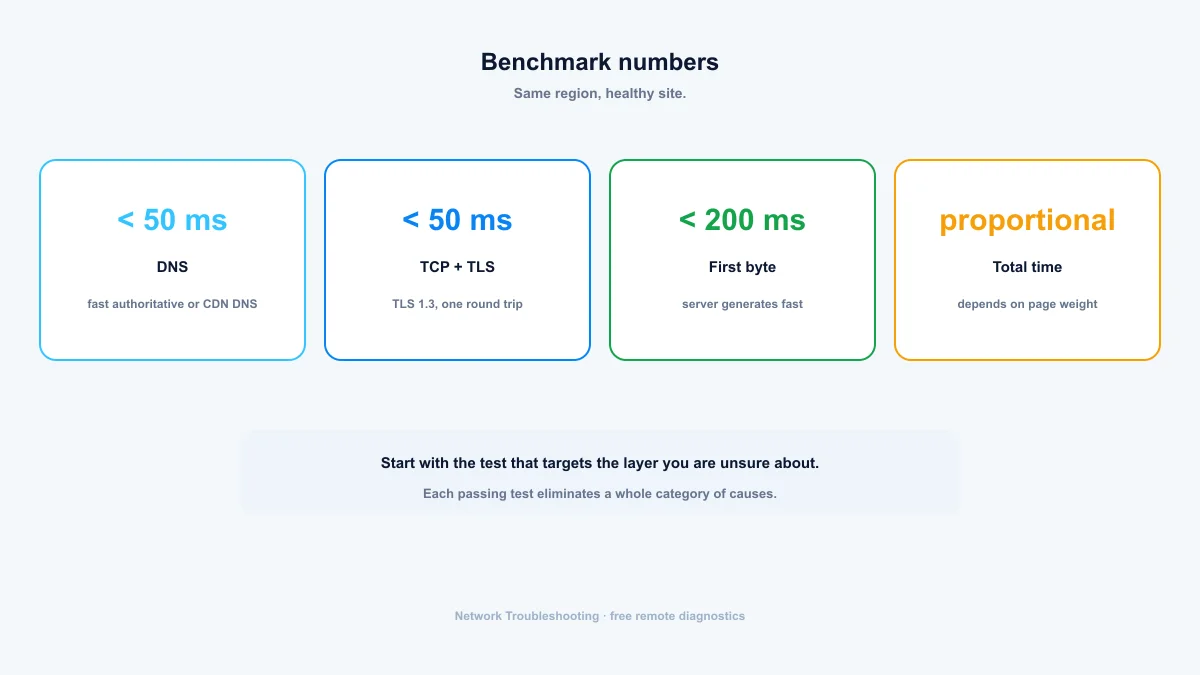
- Same region on a healthy site: DNS and TLS under 50 ms each, first byte under 200 ms.
- High first byte points at database queries, cold caches and unoptimized frameworks.
- This is server-side timing, not a Core Web Vitals score — use both.
Frequently asked questions
What is TTFB?
Time to first byte: the delay between sending the request and receiving the first byte of the response. Under 200 ms in the same region is good; over 500 ms usually means server work is the bottleneck.
Is this the same as Google PageSpeed Insights?
No. This is a server-side timing from a single remote probe. PageSpeed Insights runs a real browser and measures Core Web Vitals, including rendering. Use each for what it's good at: server health here, front-end performance there.
Why is my website slow from another country?
Distance adds latency to every round trip, and without a CDN the routing may be suboptimal. Run the test from each region to separate unavoidable distance from fixable problems.
Does HTTPS slow down my website?
Minimally. TLS 1.3 costs one extra round trip at connection time, a few milliseconds on healthy paths, and the security gain is worth it. The exception is a misconfigured or CPU-bound TLS setup, where it genuinely slows things down.
What is a good speed test result?
Measured in the same region on a healthy site: DNS under 50 ms, TCP and TLS under 50 ms each, first byte under 200 ms, and a total time proportional to the page size. Absolute numbers depend on distance and page weight.
Free, no account required. Results show the exact probe location for every measurement.